Huw Wilkins
on 19 June 2020
Making the MAAS machine list fast with React
We have been transitioning the web interface for MAAS from AngularJS to React. One of the reasons for this is to make the interface faster.
The main page with performance issues is the list of machines. This list needs to be fast at displaying a few hundred machines at a bare minimum.
So what happens when you rebuild the page and discover it isn’t as fast as you need it to be?
This was our predicament. We knew React had a bunch of tools for increasing performance, some of which we had used sporadically.
Our first action could have been to throw all these tools at the page and see if that felt any better.
Instead, we decided to see if we could measure the page’s performance to figure out why it was slow.
React profiler
If you haven’t used the React profiler before, it is a panel in the React DevTools which you can use to record an action and see a timing report. Here’s a report of what happened when we navigated to the machine list:
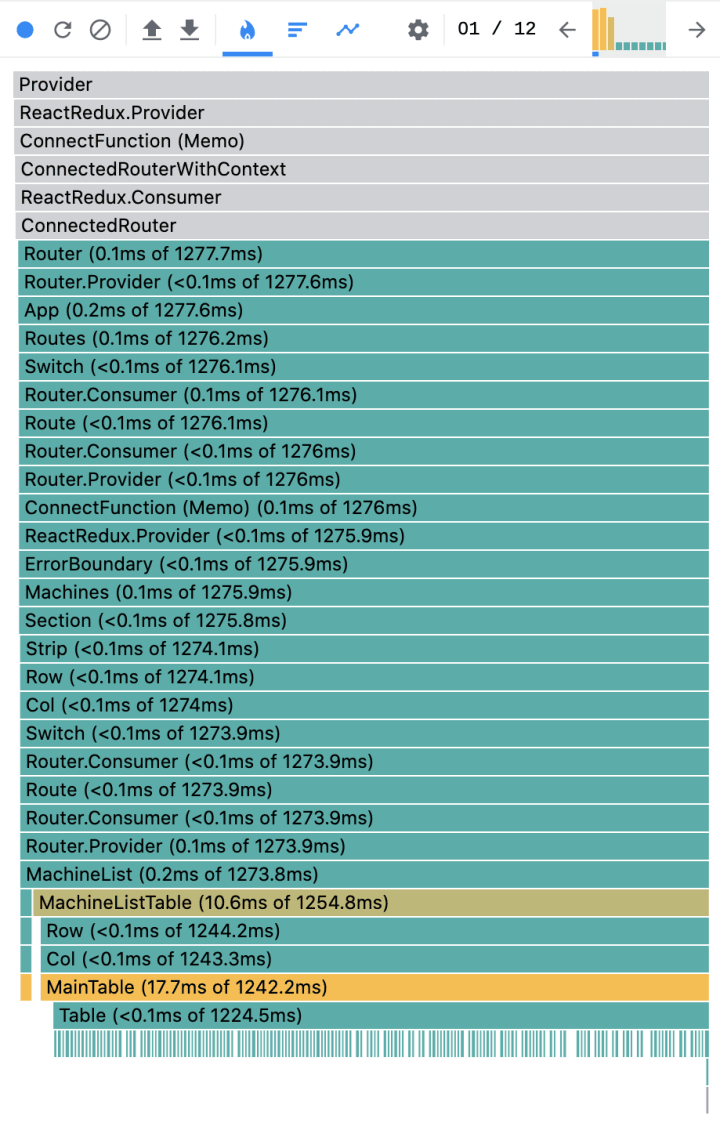
Yuck! If you haven’t seen a profiler like this it can be a bit intimidating, so let’s have a quick look at what it all means.
First there’s a chart of how many renders there were:
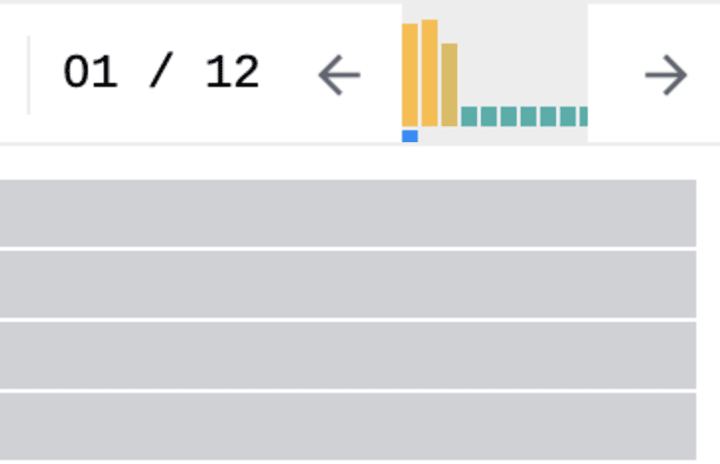
Here we could see that the machine list had rendered 12 times and that the first three renders were taking a lot of time. Clicking on one of those bars will show the details of that particular render.
Next there’s a list of the time it took for each component to render, with each component broken down by its children as you move down the list.
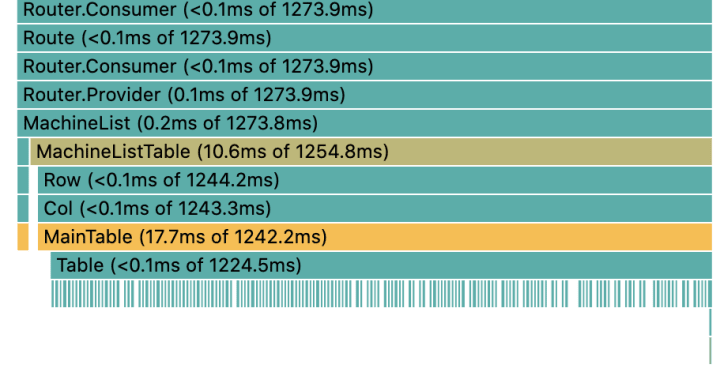
Clicking on a component shows you a more zoomed in view of that component and its children.
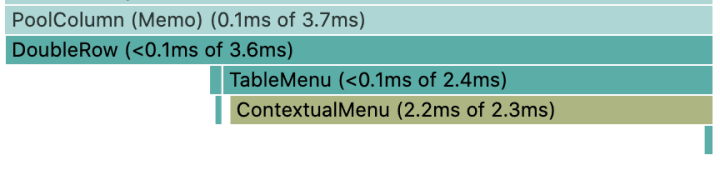
Here you can see a blank space below the component which is the amount of processing time it took for that component and the rest of the time is displayed by how long the children took to render.

If you turn on “Record why each component rendered while profiling.” in the profiler settings you can hover over a component and see why it rendered.

Now we could see exactly what was going on for this page and for each change we made we could measure the impact.
Memoisation
The issues we discovered were largely due to a few recurring problems. Usually the components were rerendering because the parent rerendered or because they were recomputing data that hadn’t changed. Here a few of the tools we used to fix those issues:
React.memo
You can wrap a component in React.memo() to stop it rerendering if the props passed to the component haven’t changed. Memoisation always comes at an initial performance cost so using React.memo on a component where the props change frequently can sometimes produce a drop in performance.
useMemo, useCallback and useSelector
These three hooks; useMemo, useCallback and useSelector (provided by Redux) allow you to memoize data and functions so that the references don’t change unless the hook needs to recompute the result. Not only does this help the component to not rerender if the data hasn’t changed, but it also won’t pass new references to the child components and cause them to rerender too.
The results
Using all the techniques above we managed to hugely improve the performance of the machine list. Rendering 200 machines we went from 12 renders (three of which were over 1 second each) to 4 renders (the longest being ~350ms and the rest sub 3ms).
If you’re using React and you have performance issues, hopefully this has given you some insight into how you can make your app faster.
If you use MAAS and have had performance issues in the past or are keen to try it out, why not give the new 2.8 release a go.